
⚠️ Update: #Afghanistan is now in the midst of a total internet blackout as Taliban authorities move to implement morality measures, with multiple networks disconnected through the morning in a stepwise manner; telephone services are currently also impacted
Discussion
Loading...
Post
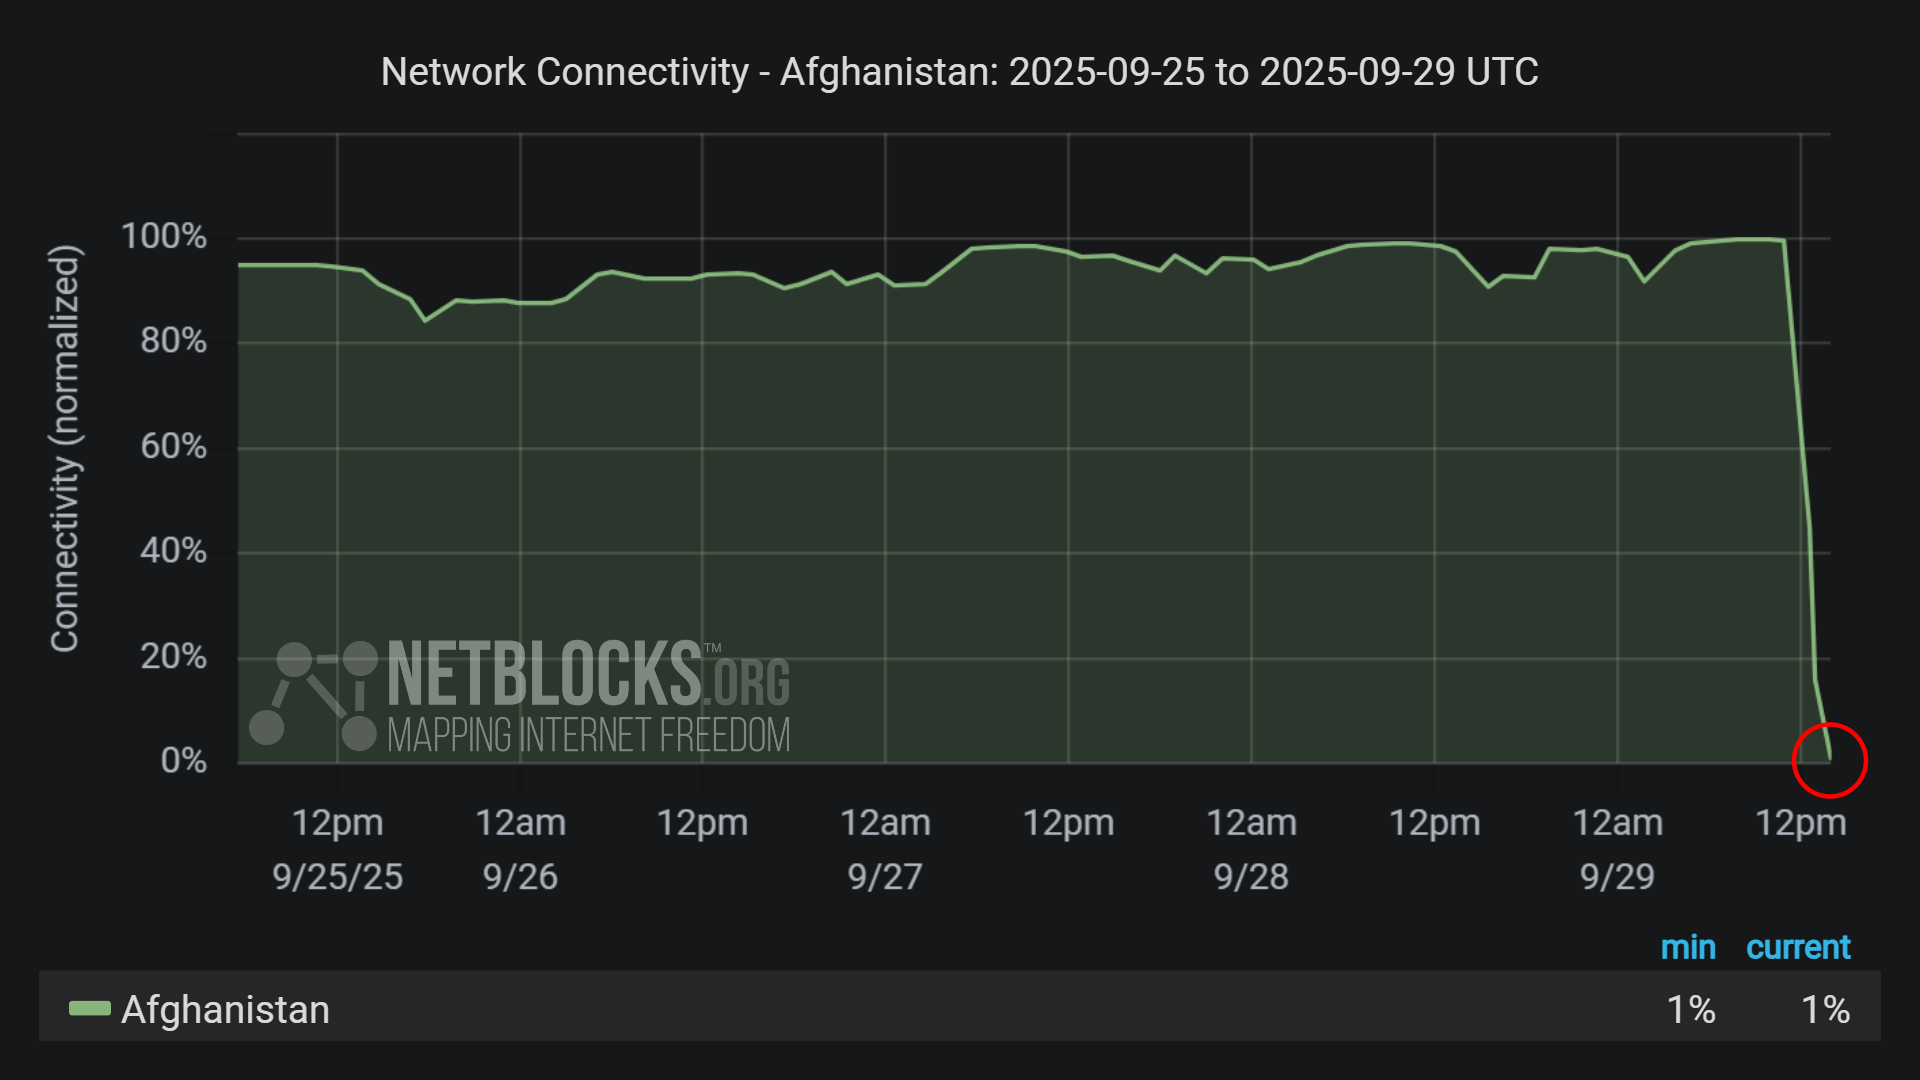
⚠️ Update: #Afghanistan is now in the midst of a total internet blackout as Taliban authorities move to implement morality measures, with multiple networks disconnected through the morning in a stepwise manner; telephone services are currently also impacted
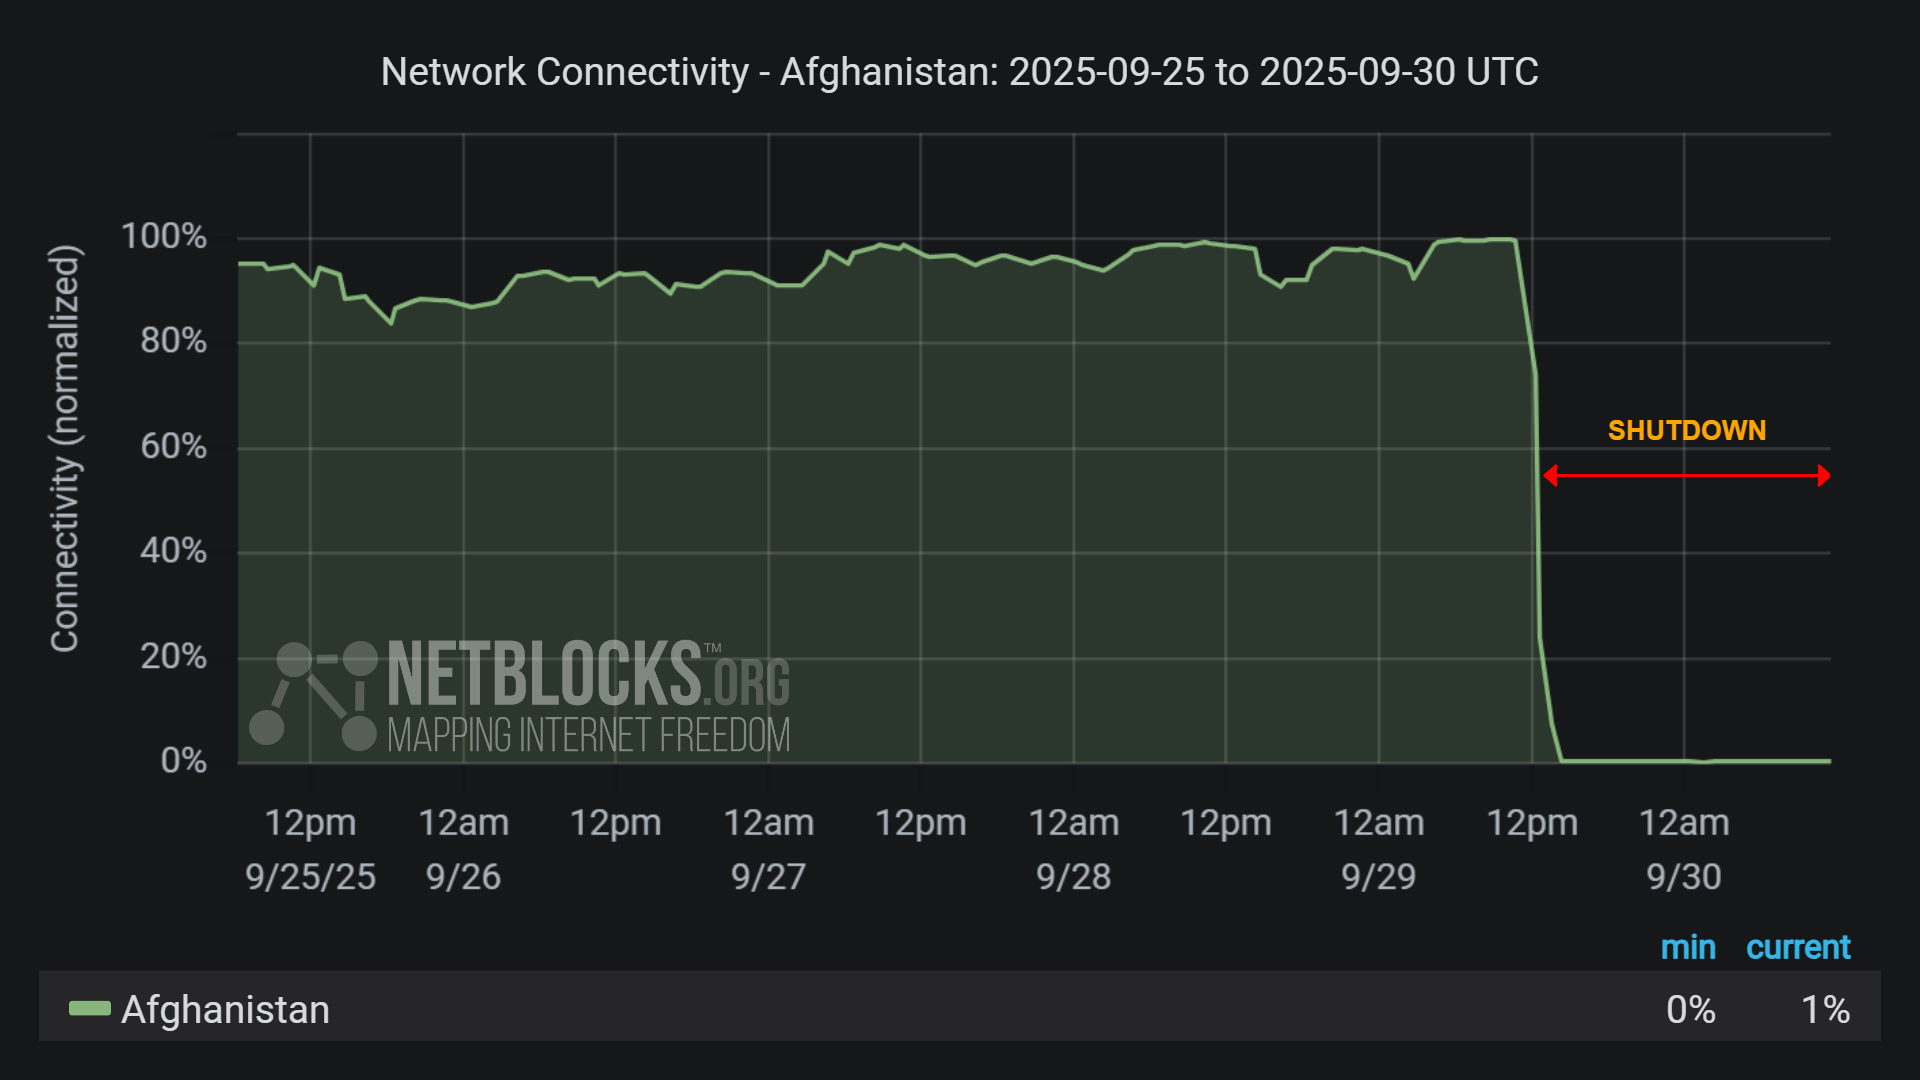
⚠️ Update: It has now been 24 hours since #Afghanistan imposed a national internet blackout, cutting off residents from the rest of the world; the ongoing measure marks the Taliban's return to conservative values it espoused a quarter of a century ago limiting basic freedoms
Open Science
We are a network of scientists, developers and organizations building the next generation of digital spaces for open science.
Automatic federation enabled