Discussion
Loading...

Post

  • About
  • Code of conduct
  • Privacy
  • Users
  • Instances
  • About Bonfire
NetBlocks
@netblocks@mastodon.social  ·  activity timestamp 4 days ago

⚠️ Confirmed: Live network data show a collapse in internet access in #Afghanistan with high impact to Kabul, leaving national connectivity at 30% of ordinary levels; the incident follows telecoms disruptions in the provinces as the Taliban leadership targets "immoral" activities

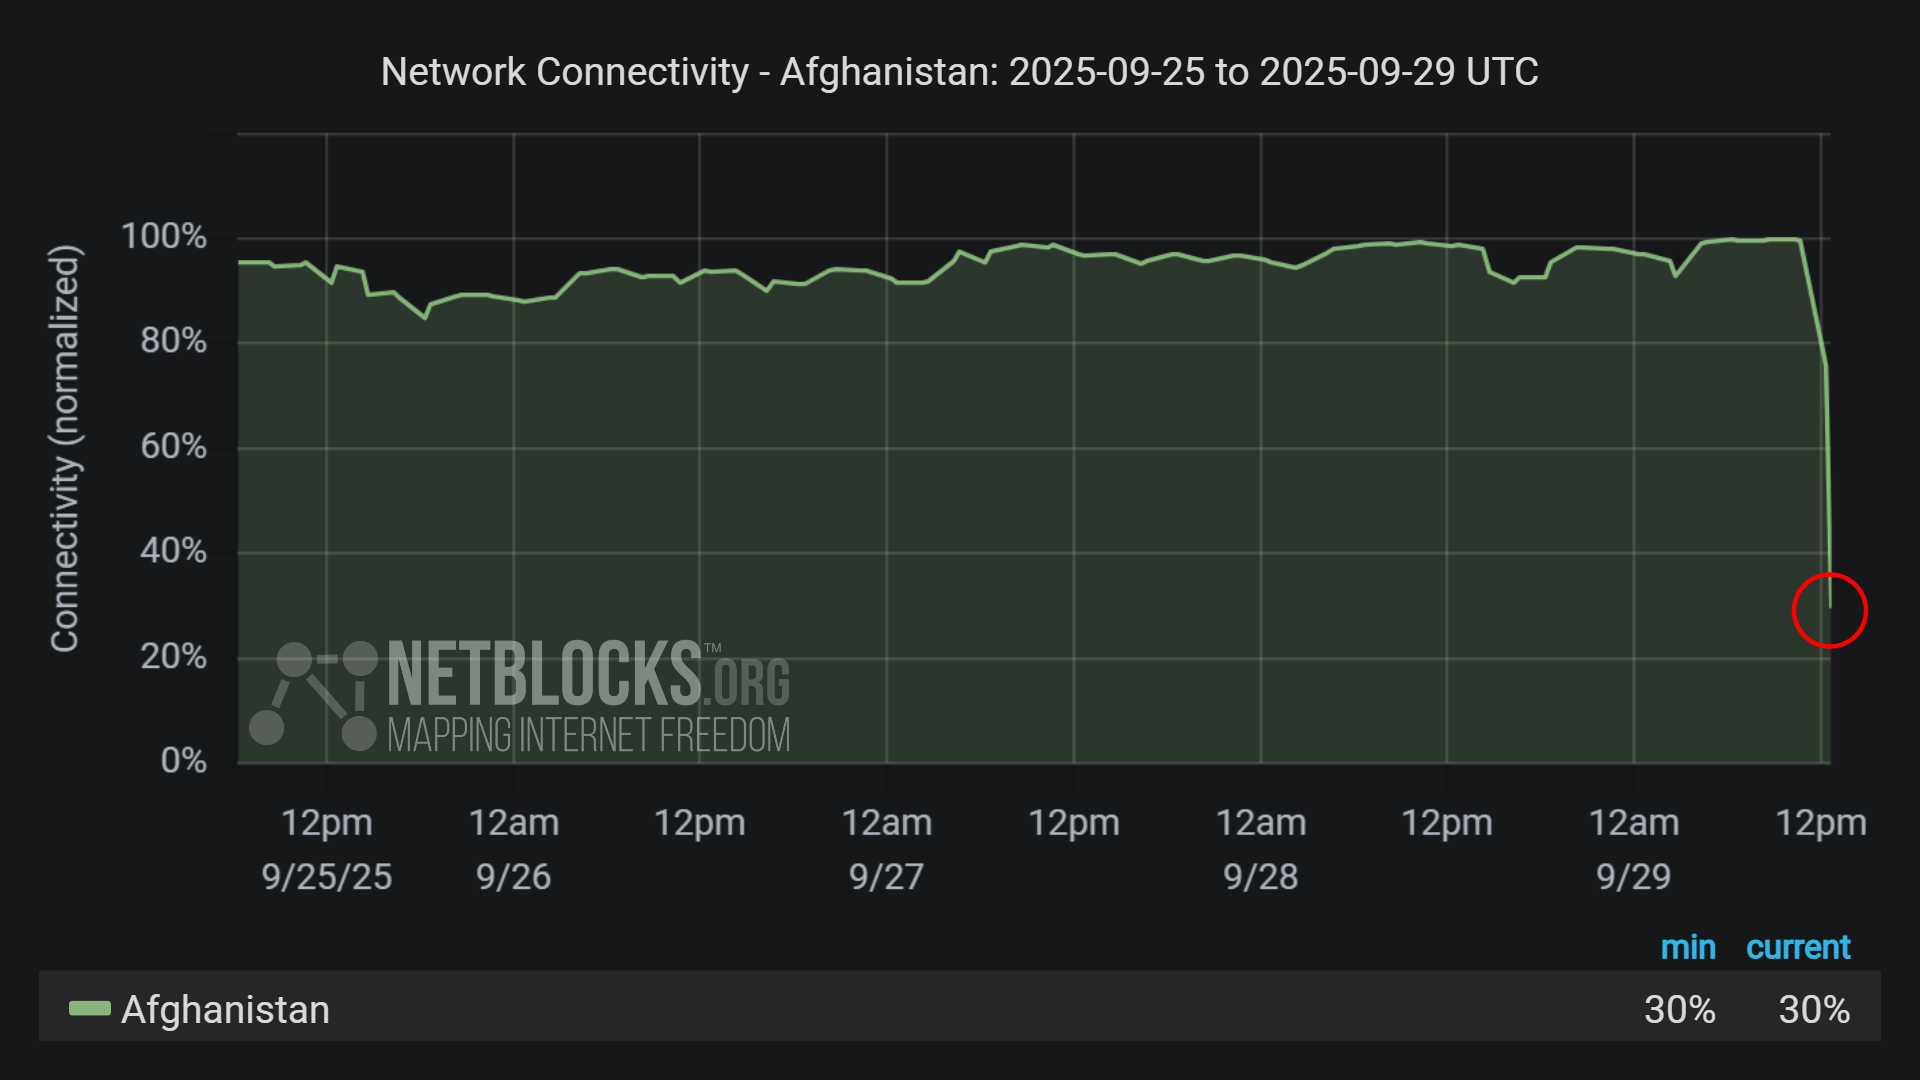
Graph from NetBlocks showing the network connectivity in Afghanistan, from September 25, 2025, to September 29, 2025. The y-axis represents normalized connectivity, ranging from 0% to 100%, and the x-axis represents the dates. The green line representing Afghanistan's connectivity remains stable at around 100% throughout most of the time period, with a sharp drop on the after of September 29. The minimum and current connectivity levels are indicated as 30% and 30%, respectively. The chart has a dark background with a red circle highlighting the decline at the end of the period.
  • Copy link
  • Flag this post
  • Block
Log in

Open Science

We are a network of scientists, developers and organizations building the next generation of digital spaces for open science.

Open Science: About · Code of conduct · Privacy · Users · Instances
Bonfire open science · 1.0.0-rc.2.35 no JS en
Automatic federation enabled
  • Explore
  • About
  • Members
  • Code of Conduct
Home
Login